ECE295 Course Project⚡
Hardware Design of an SDR RX Reciever Chain 📡
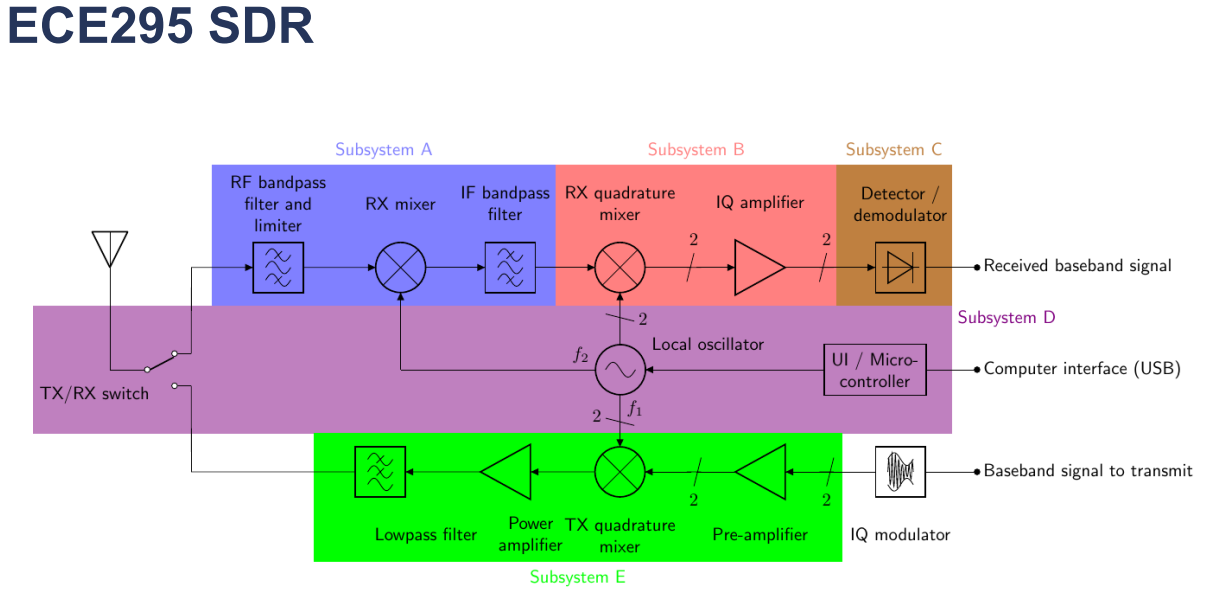
For my ECE295 (Hardware Design and Communication) course project, me and my group of three were tasked with designing from scratch, assembling, and testing/validating an RX reciever chain to be integrated with five other subsystems to form a complete, functioning Software Defined Radio (SDR). Our reciever chain recieves raw, unfiltered signals from an antenna and passes them through a limiter circuit to protect board elements from high voltages, a bandpass filter to pass through signals only in the 8-16 MHz range, two quadrature mixers to mix signals and two lowpass filter + amplifier configurations to further filter signals and amplify them before transmitting signals to another subsystem. Overall, the primary design focuses for our reciever were simplicity in design/assembly/debugging and power efficiency!
PCB Design and Assembly 📟🛠️
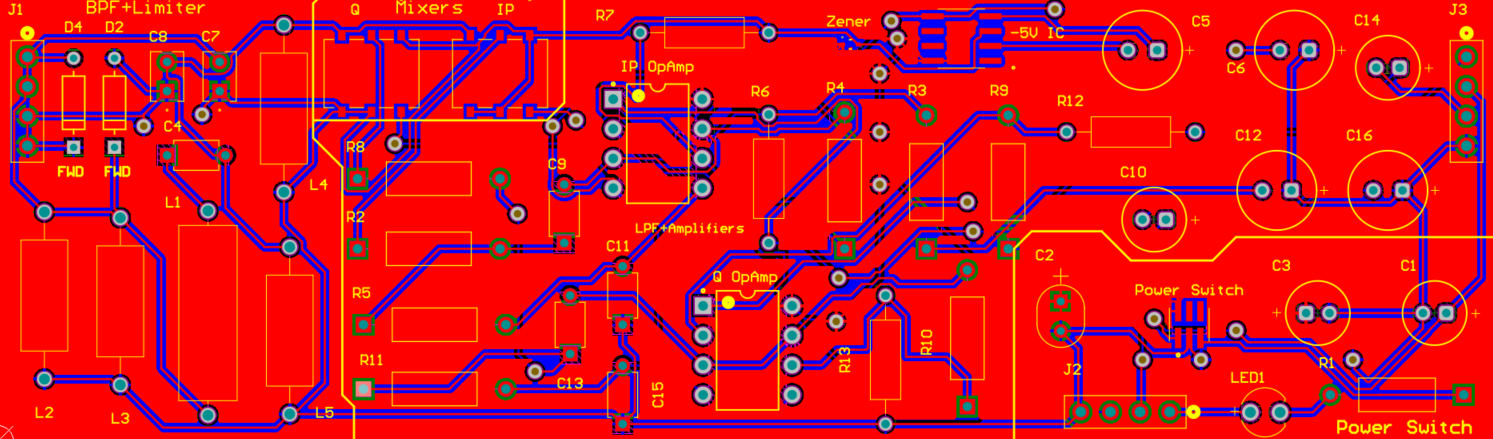
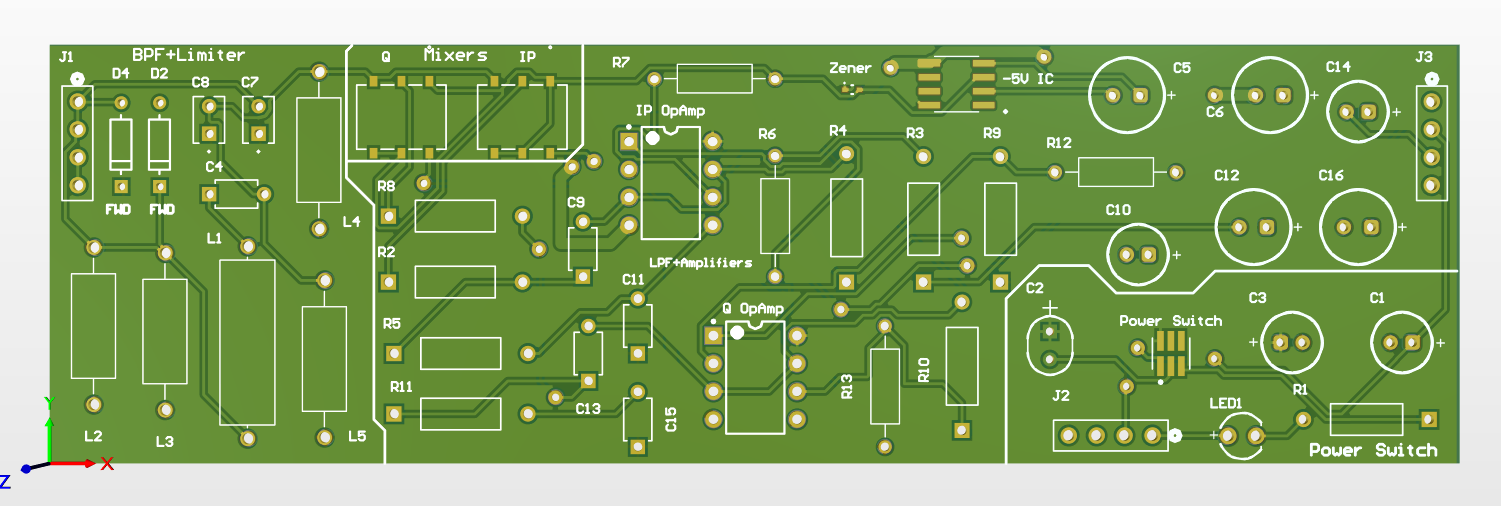
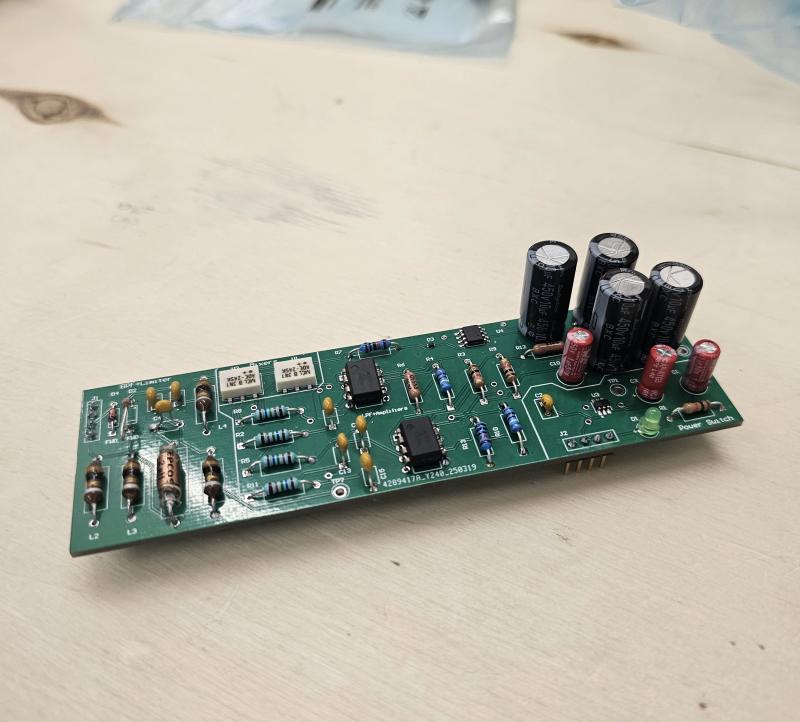
After creating detailed electrical schematics and conducting simulations in LTspice for each subcomponent of the reciever chain as well as power and I/O, the team utilized Altium CAD to design the PCB layout shown below. I was in charge of placing and arranging component footprints in a space-efficient manner as well as routing the majority of traces on the board and introducing power/ground planes. When it came to assembly, I also soldered the majority of the through-hole and SMD components
Testing and Validation 🧪✅
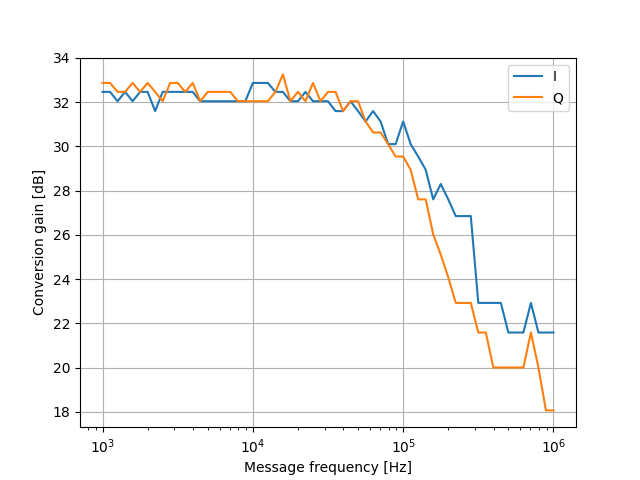
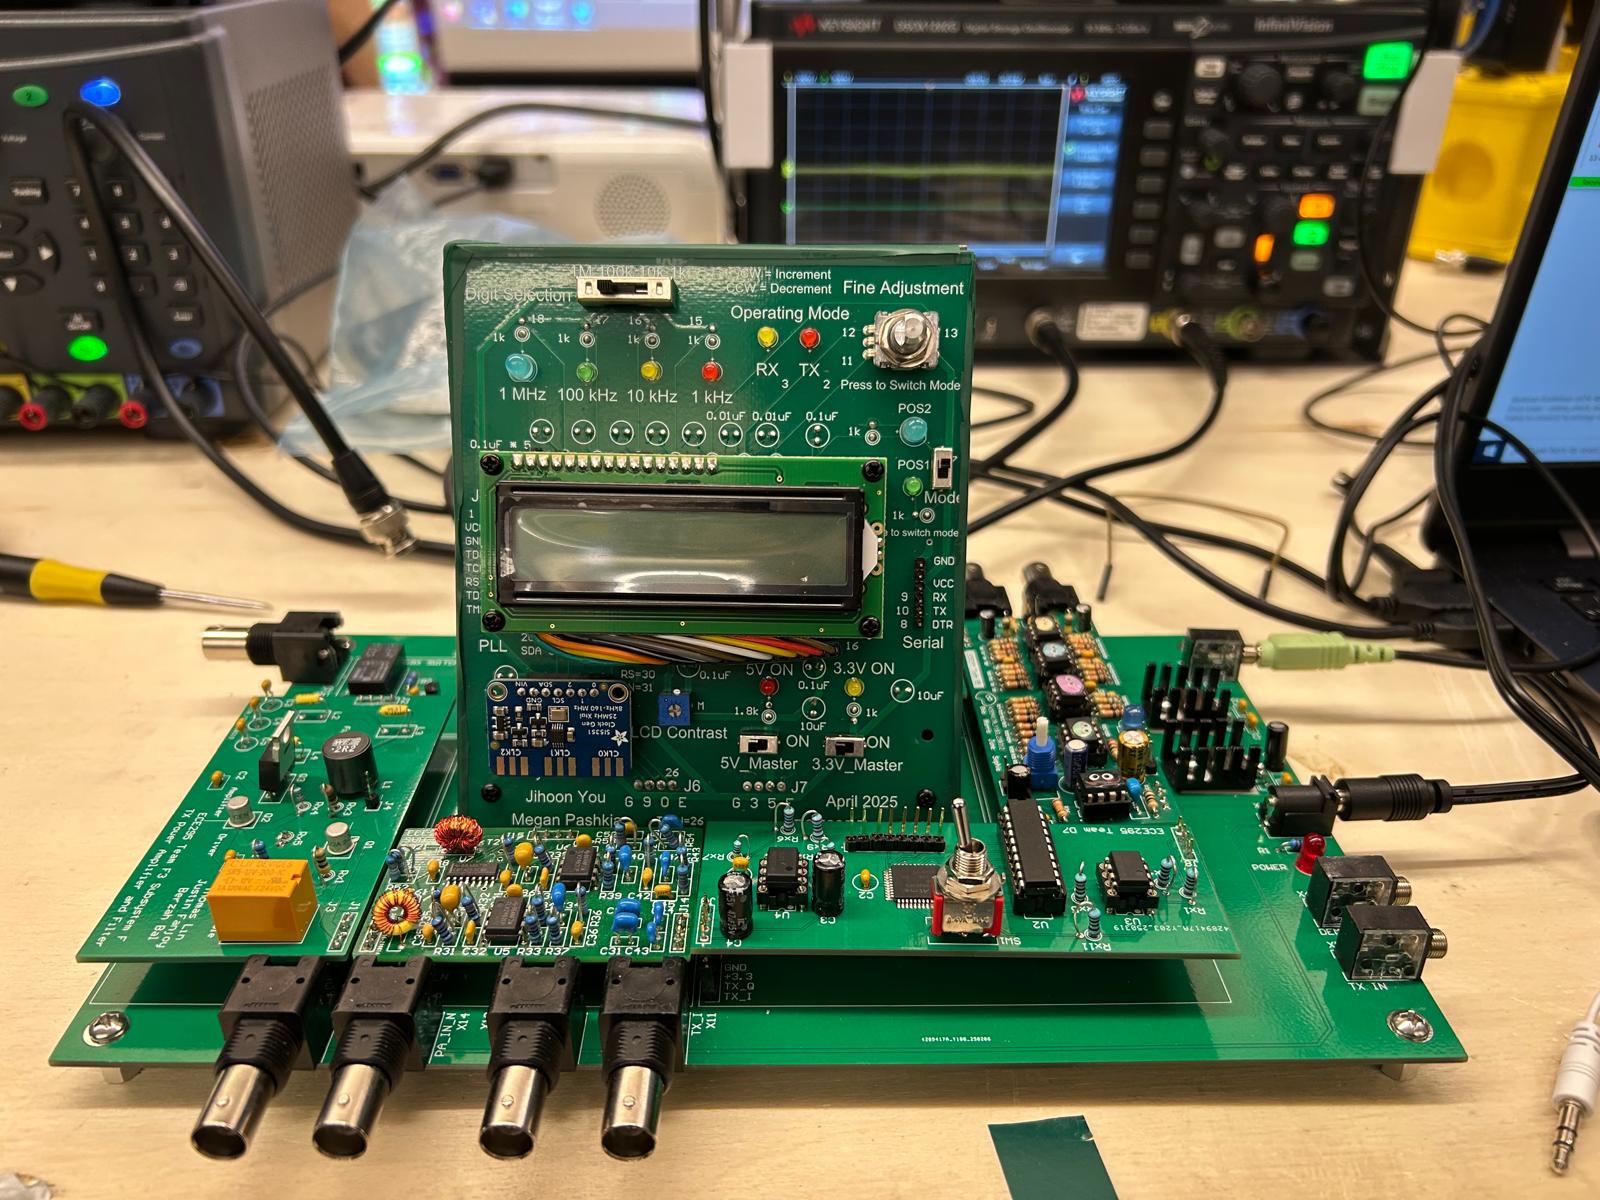
In order to test our reciever chain and ensure that it had met Interface Control Document (ICD) requirements, our group used a combination of manual and automated testing procedures. Manual testing involved utilizing oscilloscopes, DMMs, and waveform generators connected to our reciever to pass waveforms of varying frequencies and amplitudes and ensure functionality of the reciever subcomponents. To further validate our tests, we modified and executed test scripts in Python that utilize the PyVisa library to remotely connect to the measurement devices and perform amplitude/frequency sweeps with hundreds of test points. An example of a graph generated by the test scripts for our lowpass filter (cutoff ~100 kHz) is shown below. All in all, our system was one of 18/74 groups that integrated succesfullly with other subsystems to form the whole radio seen in the bottom right (our subsystem is behind the large one in the middle so it isn't visible here)!